Looking for the best tools to track and improve your B2B sales performance? Real-time sales dashboards can help you make faster, data-driven decisions, reduce sales cycles, and boost win rates. Here’s a quick summary of the top 7 platforms:
- Klipfolio: Connects 130+ data sources with customizable visualizations.
- Looker: Offers advanced analytics and seamless integration with Google Cloud.
- Gong: AI-powered insights for conversation analysis and accurate forecasting.
- InsightSquared: Combines AI-driven forecasting with pipeline management.
- Pipedrive: Simplifies sales tracking with a visual pipeline and automation.
- Coefficient: Integrates live data into Google Sheets for easy analysis.
- ZoomInfo: Provides sales intelligence with buyer intent tracking and enriched data.
These tools are packed with features like real-time updates, integration with CRMs, customizable dashboards, and advanced analytics. Whether you need better forecasting, pipeline management, or actionable insights, this list has you covered.
Quick Comparison
| Platform | Key Features | Ideal For | Pricing |
|---|---|---|---|
| Klipfolio | Customizable visualizations, 130+ integrations | Data-heavy teams | Custom pricing |
| Looker | Advanced analytics, Google Cloud integration | Enterprise-level insights | Custom pricing |
| Gong | AI insights, conversation analysis | Sales coaching & forecasts | $5K–$50K/year |
| InsightSquared | AI forecasting, pipeline management | RevOps teams | $65–$95/user/mo |
| Pipedrive | Visual pipeline, automation | Small to mid-sized teams | Starts at $14.90/mo |
| Coefficient | Google Sheets integration, live data sync | Spreadsheet users | Custom pricing |
| ZoomInfo | Buyer intent tracking, enriched data | Lead generation | Custom pricing |
These dashboards empower B2B teams to stay agile, improve collaboration, and drive better results. Dive into the article to find the perfect fit for your sales needs.
7 Best Dashboard Software Tools in 2024
Must-Have Sales Dashboard Features
Let’s break down the features that make a B2B sales dashboard truly effective. For instance, 82% of revenue leaders say that unified tools improve revenue outcomes .
Real-Time Data Updates
Having real-time updates is a game-changer. Businesses with data-driven sales engines see EBITDA increases of 15–25% , allowing them to make quick, informed decisions.
Integration Capabilities
A great dashboard connects effortlessly with essential tools like CRMs, marketing platforms, communication systems, and analytics tools.
| Integration Type | Purpose | Impact |
|---|---|---|
| CRM Platforms | Manage customer data easily | Reduces manual errors |
| Marketing Tools | Track campaign performance | Improves lead qualification |
| Communication Systems | Enhance team collaboration | Simplifies information sharing |
| Analytics Platforms | Measure performance metrics | Supports data-backed decisions |
Customization Options
Customization helps make sense of complex data. Ali Flynn, Co-Founder at Improvado, sums it up well:
"A sales dashboard centralizes and simplifies sales data, making complex information easy to understand."
Security Features
Look for features like end-to-end encryption, role-based access controls, regular audits, and compliance checks to keep your data secure.
Scalability
Dashboards should grow with your business. They need to handle increasing data loads without slowing down. Notably, 64% of B2B companies plan to boost investments in predictive analytics .
Visual Analytics
Visual analytics simplify complex numbers into actionable insights. They reduce manual work, cut down errors, and make it easier to spot trends, improving communication across teams .
Automated Reporting
Automated reporting saves time and ensures consistent data. It also helps fix alignment issues, which 87% of organizations struggle with .
Next, we’ll dive into some of the best dashboards that include these must-have features.
1. Klipfolio
Klipfolio is a real-time dashboard platform designed for B2B sales teams, praised by industry experts for its ability to connect various data sources seamlessly .
Integration Capabilities
Klipfolio supports over 130 data services , making it easy for B2B teams to bring together data from multiple systems into one unified view. It works effortlessly with popular sales tools, analytics platforms, and business systems, creating a streamlined data environment.
| Integration Category | Examples | Business Use |
|---|---|---|
| Sales Tools | Salesforce, Pipedrive, HubSpot | Track sales in real time |
| Analytics | Google Analytics, Adobe Analytics | Monitor performance metrics |
| Communication | Intercom, Zendesk, Help Scout | Track customer interactions |
| Financial | Stripe, QuickBooks, Xero | Keep tabs on revenue |
Customization and Visualization
Klipfolio allows teams to create highly tailored dashboards using HTML, CSS, and JavaScript. This enables businesses to design visualizations that align with their specific goals and workflows.
"I build dashboards for clients across many industries and it is by far the best tool I’ve come across for building KPI reports that are used daily and motivate teams to make progress on business goals." – Andrew W., Director at IT MOOTI
Real-Time Performance Tracking
Klipfolio’s real-time monitoring features provide actionable insights that help businesses stay on top of their performance. Sebastián P., CPO at E-Planning.net, highlights this benefit:
"We upload daily data about our business and it’s really helpful to get insights and monitor revenue in real-time."
Advanced Display Options
Klipfolio offers multiple ways to share dashboards, making it easier to keep everyone informed:
- TV display mode for visibility in office spaces
- Automated reports for stakeholders
- User and group-based access controls
- Public links for sharing with external audiences
These features improve transparency and collaboration across departments. Up next, we’ll take a closer look at Looker and how it stacks up in the realm of real-time data performance.
2. Looker

Looker, now part of Google Cloud, provides tools for creating data visualizations and enterprise analytics to deliver real-time insights. Let’s break down the features that make Looker stand out.
Core Dashboard Features
Looker’s enterprise dashboards allow users to explore metrics, apply dynamic filters, and drill down into row-level details . With LookML, Looker ensures consistent analytics by centralizing business rules .
| Feature Category | Capabilities | Business Impact |
|---|---|---|
| Data Integration | 800+ data sources and connectors | Broader and deeper data analysis |
| User Access | Standard, Developer, and Viewer roles | Customized permissions by role |
| Analytics Tools | Self-service analytics, Gemini AI integration | Better insights generation |
| Visualization | Dynamic filtering, real-time updates | Easier access to actionable data |
Seamless Integration
Looker’s integration with Salesforce boosts B2B sales analytics by enabling real-time tracking of leads and conversion rates .
"Just as Google organizes the world’s information and makes it universally accessible and useful, Looker does the same for your business data, making it easy to build insight-powered workflows and applications."
Performance Benefits
For example, Major League Baseball (MLB) used Looker to speed up its analytics process, delivering insights 2-3 times faster . This improvement helps B2B teams make quicker, more informed decisions in fast-moving markets.
Additional Features
Looker’s platform also includes:
- API-first architecture
- Integration with Google Cloud services
- Single Sign-On (SSO) with Google Cloud IAM
- Private networking options
- Direct connection to BigQuery
For B2B teams, Looker embeds analytics directly into tools like Salesforce, simplifying workflows and improving productivity .
3. Gong
Gong uses AI to deliver real-time sales insights and accurate forecasting for B2B teams. Its dashboard combines sales interaction data with forecasting tools to help teams improve their performance and make smarter decisions.
Key Dashboard Features
| Feature Category | Capabilities | Business Impact |
|---|---|---|
| Interaction Analysis | Real-time call recording and transcription for Zoom, Google Meet, and Microsoft Teams | Better insights into conversations |
| AI-Powered Alerts | Notifications about customer objections and pricing concerns | Helps guide sales strategies |
| Revenue Intelligence | Tracks deal health and analyzes pipelines | Improves forecast precision |
| Integration Hub | Connects with CRM, communication tools, and workflow automation | Simplifies operations |
Performance Analytics
Gong’s AI evaluates conversations across multiple channels, offering instant, actionable feedback on customer engagement and deal progress.
Real-Time Forecasting
Gong Forecast provides clear insights into your pipeline, enabling RevOps teams to act quickly. Companies like Frontify have seen game-changing results with its accuracy. These forecasts integrate seamlessly with your existing sales tools, ensuring your data stays consistent.
"Gong’s reliable and precise forecasts are now being trusted and used by our board to inform strategic decisions."
– Naya Tsoukala, Head of Revenue Operations at Frontify
Integration Capabilities
Gong integrates with essential B2B tools to ensure smooth workflows, including:
- HubSpot CRM for bi-directional syncing, offering unified data visibility
- Salesloft for a deeper understanding of sales conversations
- Workato for automating Salesforce opportunity tracking
ROI and Performance Metrics
Gong delivers measurable results, including:
- Up to 481% ROI with a payback period of under six months
- A 30% increase in lead conversion rates reported by Frontify
- A 20% improvement in forecast accuracy
Cost Overview
Gong’s pricing reflects its advanced capabilities:
- Annual platform fee: $5,000–$50,000
- Per-user licensing: $1,200–$1,600 annually
- Additional support and training: $7,500
Despite the investment, Gong’s proven ROI makes it an attractive option for B2B teams looking to elevate their sales intelligence.
sbb-itb-53539a0
4. InsightSquared

InsightSquared stands out in the world of real-time sales dashboards by offering a platform that combines sales data analytics with AI-driven insights. It’s designed to give B2B teams a clear view of their performance and help them make smarter decisions.
Core Dashboard Features
| Feature Category | Capabilities | Business Impact |
|---|---|---|
| Revenue Analytics | 350+ pre-built reports; custom dashboards | Better decision-making |
| AI Forecasting | Risk identification; opportunity tracking | More accurate forecasts |
| Pipeline Management | Interactive visualization; activity tracking | Easier deal management |
| Conversation Intelligence | Call analysis; transcript insights | Improved sales coaching |
| Activity Capture | Automated engagement tracking | Less manual data entry |
Revenue Intelligence Platform
The Revenue360 feature is a key part of InsightSquared. It centralizes pipeline management and uses AI to spot trends and improve efficiency. By breaking down data silos, it ensures teams have all the information they need in one place.
Integration Ecosystem
InsightSquared connects seamlessly with popular B2B tools, making it easy to integrate into your workflow:
- Salesforce for tracking revenue data
- HubSpot for marketing analytics
- Outreach for sales engagement
- Gong for conversation analysis
- ZoomInfo for enriched account data
Pricing Structure
InsightSquared’s pricing is tailored for businesses of all sizes:
- Per-user cost: $65–95 per month
- Custom pricing options are available for larger teams.
Performance Analytics
The platform delivers detailed insights, such as per-account metrics, team comparisons, and sales funnel visualizations. These tools help teams identify areas for improvement and boost sales productivity.
AI-Powered Features
InsightSquared’s AI tools provide actionable recommendations, real-time coaching, risk forecasting, and best practice analysis. These features help RevOps teams streamline their processes and maintain accurate forecasts and reports.
5. Pipedrive
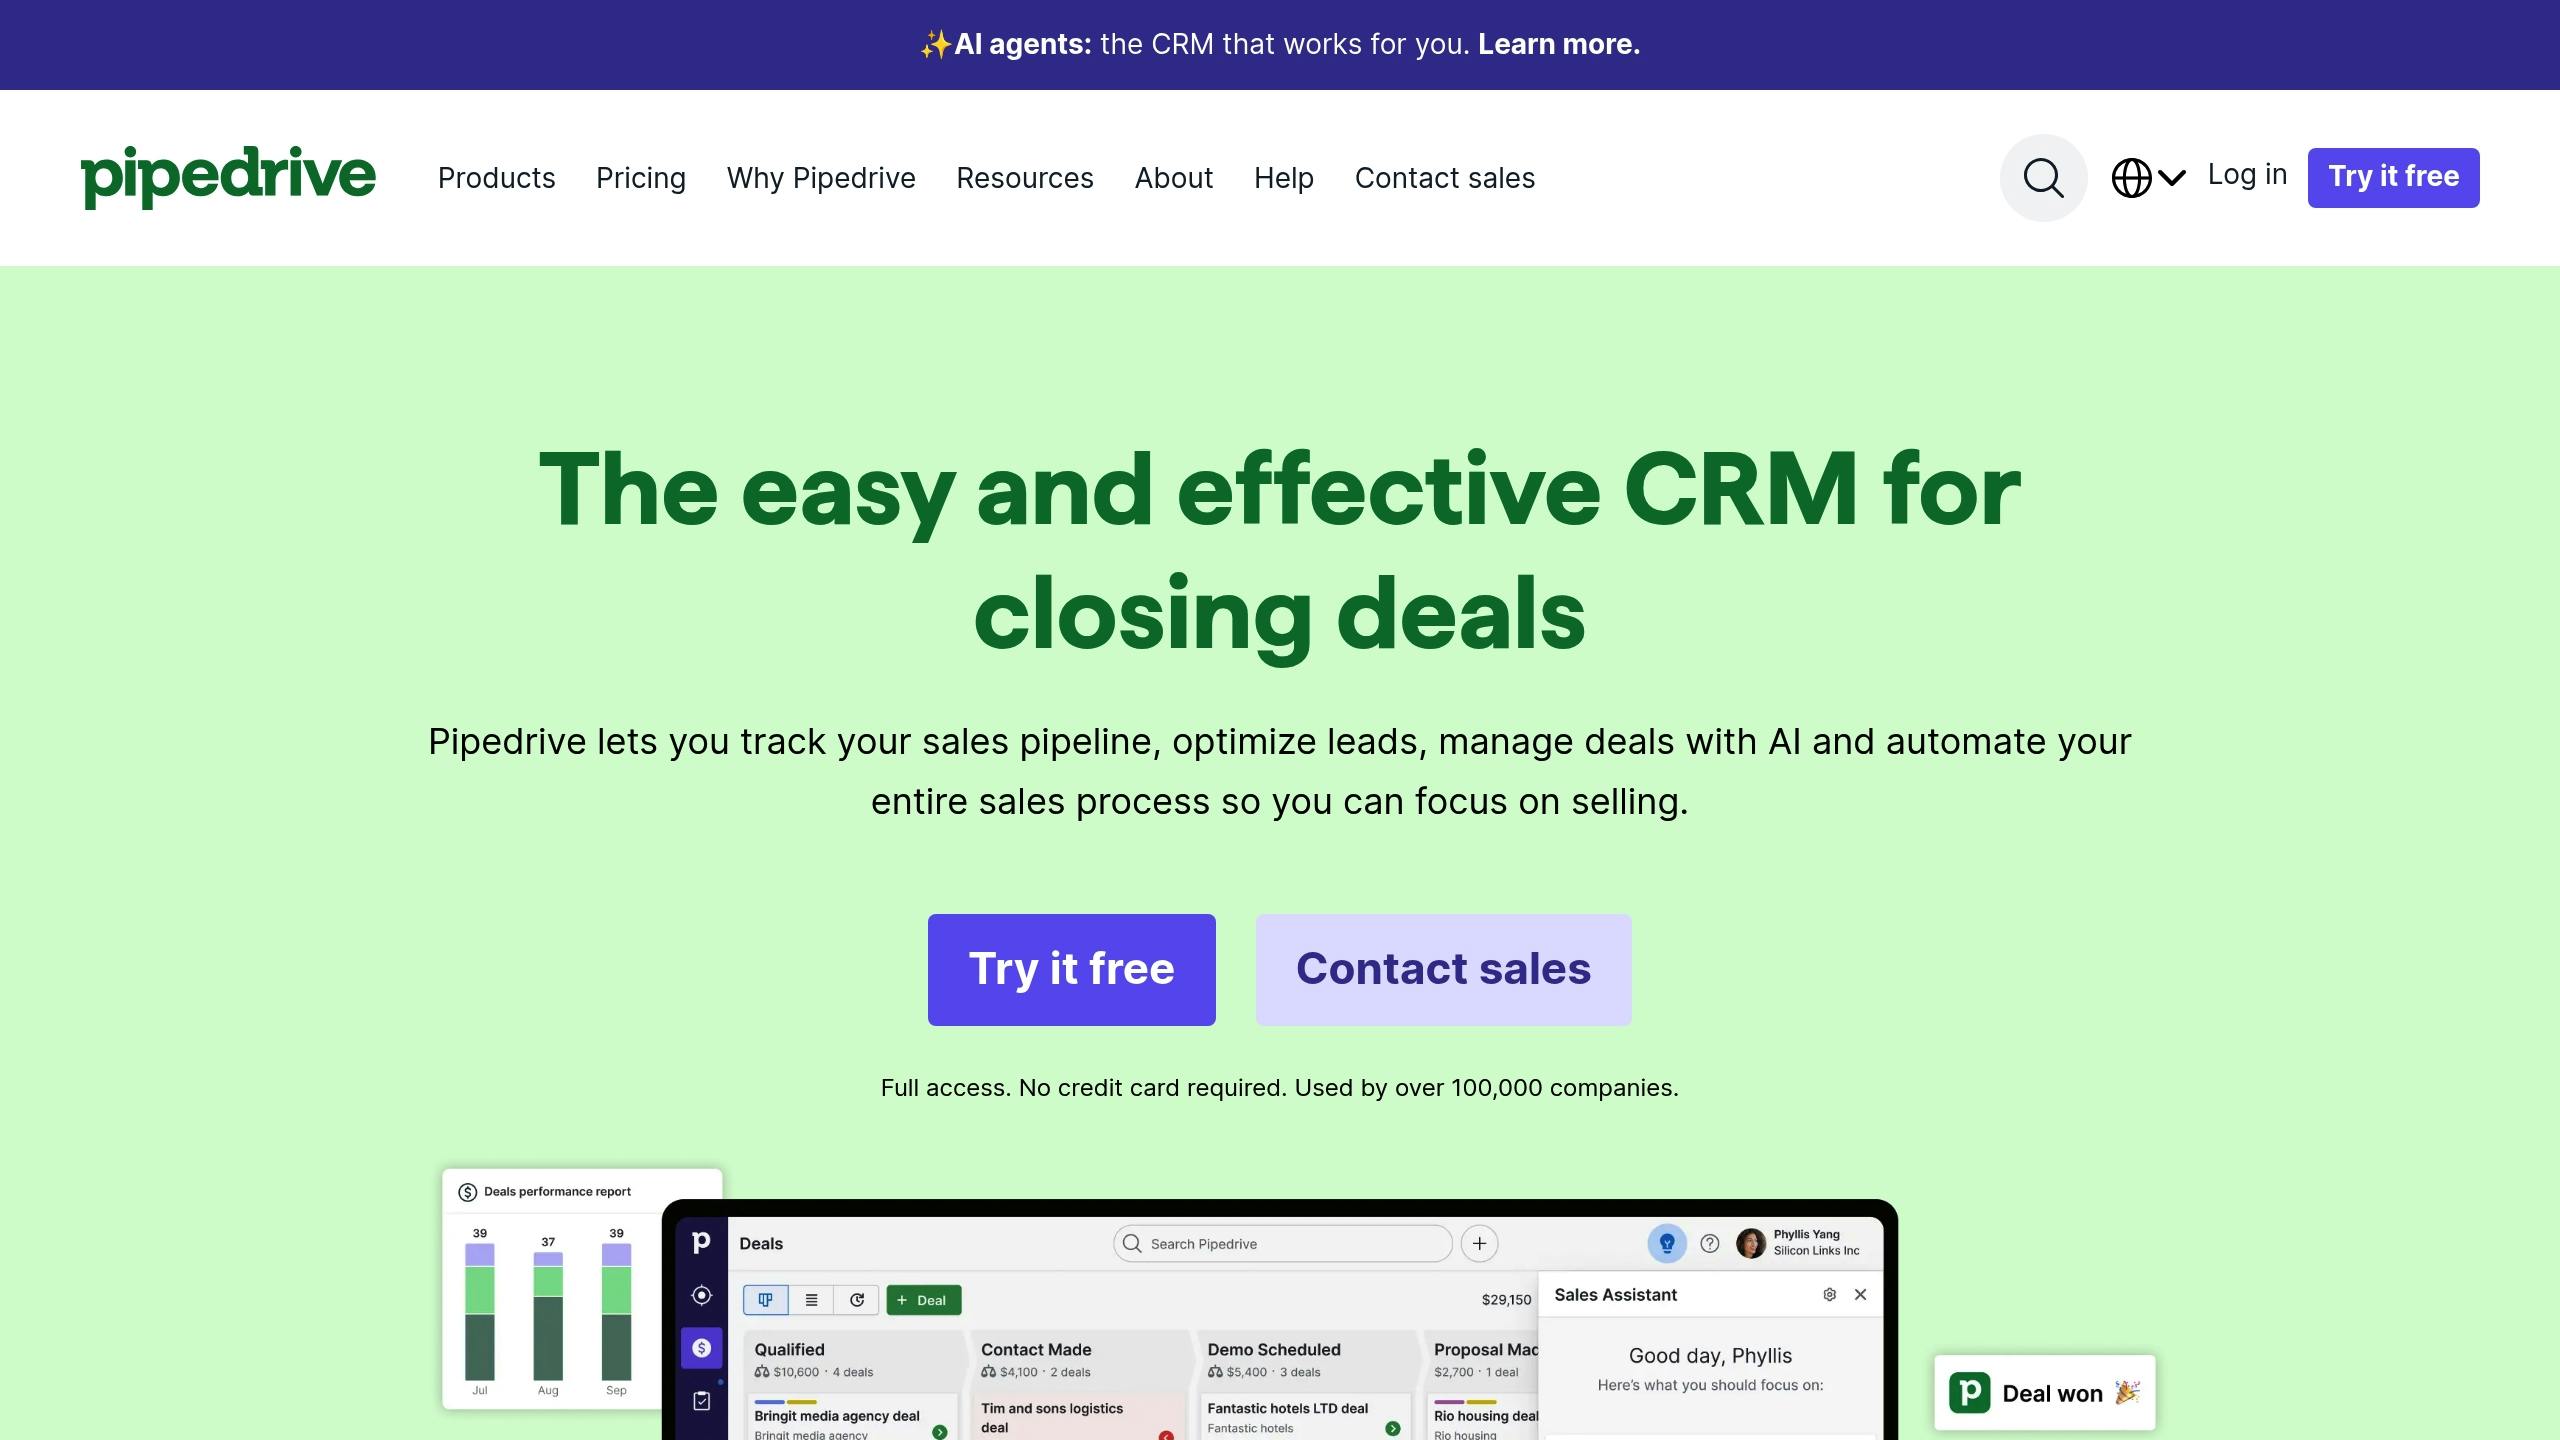
Pipedrive delivers clear, visually engaging dashboards, flexible integrations, and automation tools that simplify sales management. Trusted by over 100,000 companies in 179 countries , it has become a go-to platform for sales visualization and pipeline tracking.
Dashboard Visualization Features
| Feature | Capability | Business Impact |
|---|---|---|
| Visual Pipeline | Interactive deal tracking | Clear view of the sales process |
| Insights Dashboard | Tools for recognizing patterns | Better workflow management |
| Custom Reports | Tracks metrics & KPIs | Monitors team performance |
| Real-time Notifications | Automated follow-ups | Faster response times |
| Mobile Access | Android & iOS apps | Manage sales anywhere |
Customizable Analytics
Pipedrive’s Insights feature helps teams transform sales data into visual reports, making it easier to spot trends and improve workflows. Managers can customize reports to track standard metrics or tailor them to specific KPIs .
Integration Ecosystem
With over 500 ready-made integrations available in the Pipedrive Marketplace , connecting with essential tools is simple. For unique business needs, the platform’s open API allows teams to build their own integrations. These connections have been shown to directly improve performance metrics.
"By customizing and automating the customer journey, we were able to remove so much clutter, bottlenecking, manual admin and confusion." – Karl Brown, Founder and CEO, Instyle Solar
Impact and Results
Clients have seen measurable success, including revenue increases of up to 40%, stronger lead generation, and tripled revenues through pipeline customization .
"Pipedrive adapts well to what we need, and I like that. Unlike other CRM solutions, it fits our needs and doesn’t force us to simply conform to what it can provide." – Franziska Palumbo-Seidel, CEO and Founder, Key Search
Automation and Performance
Pipedrive’s automation tools handle follow-ups and keep pipelines updated, helping teams pinpoint bottlenecks and adjust strategies. Its interactive dashboard is also a great tool for coaching sales reps and ensuring consistent team performance . Customizable reports make sharing and organizing sales data fast and efficient, streamlining the entire sales process.
6. Coefficient
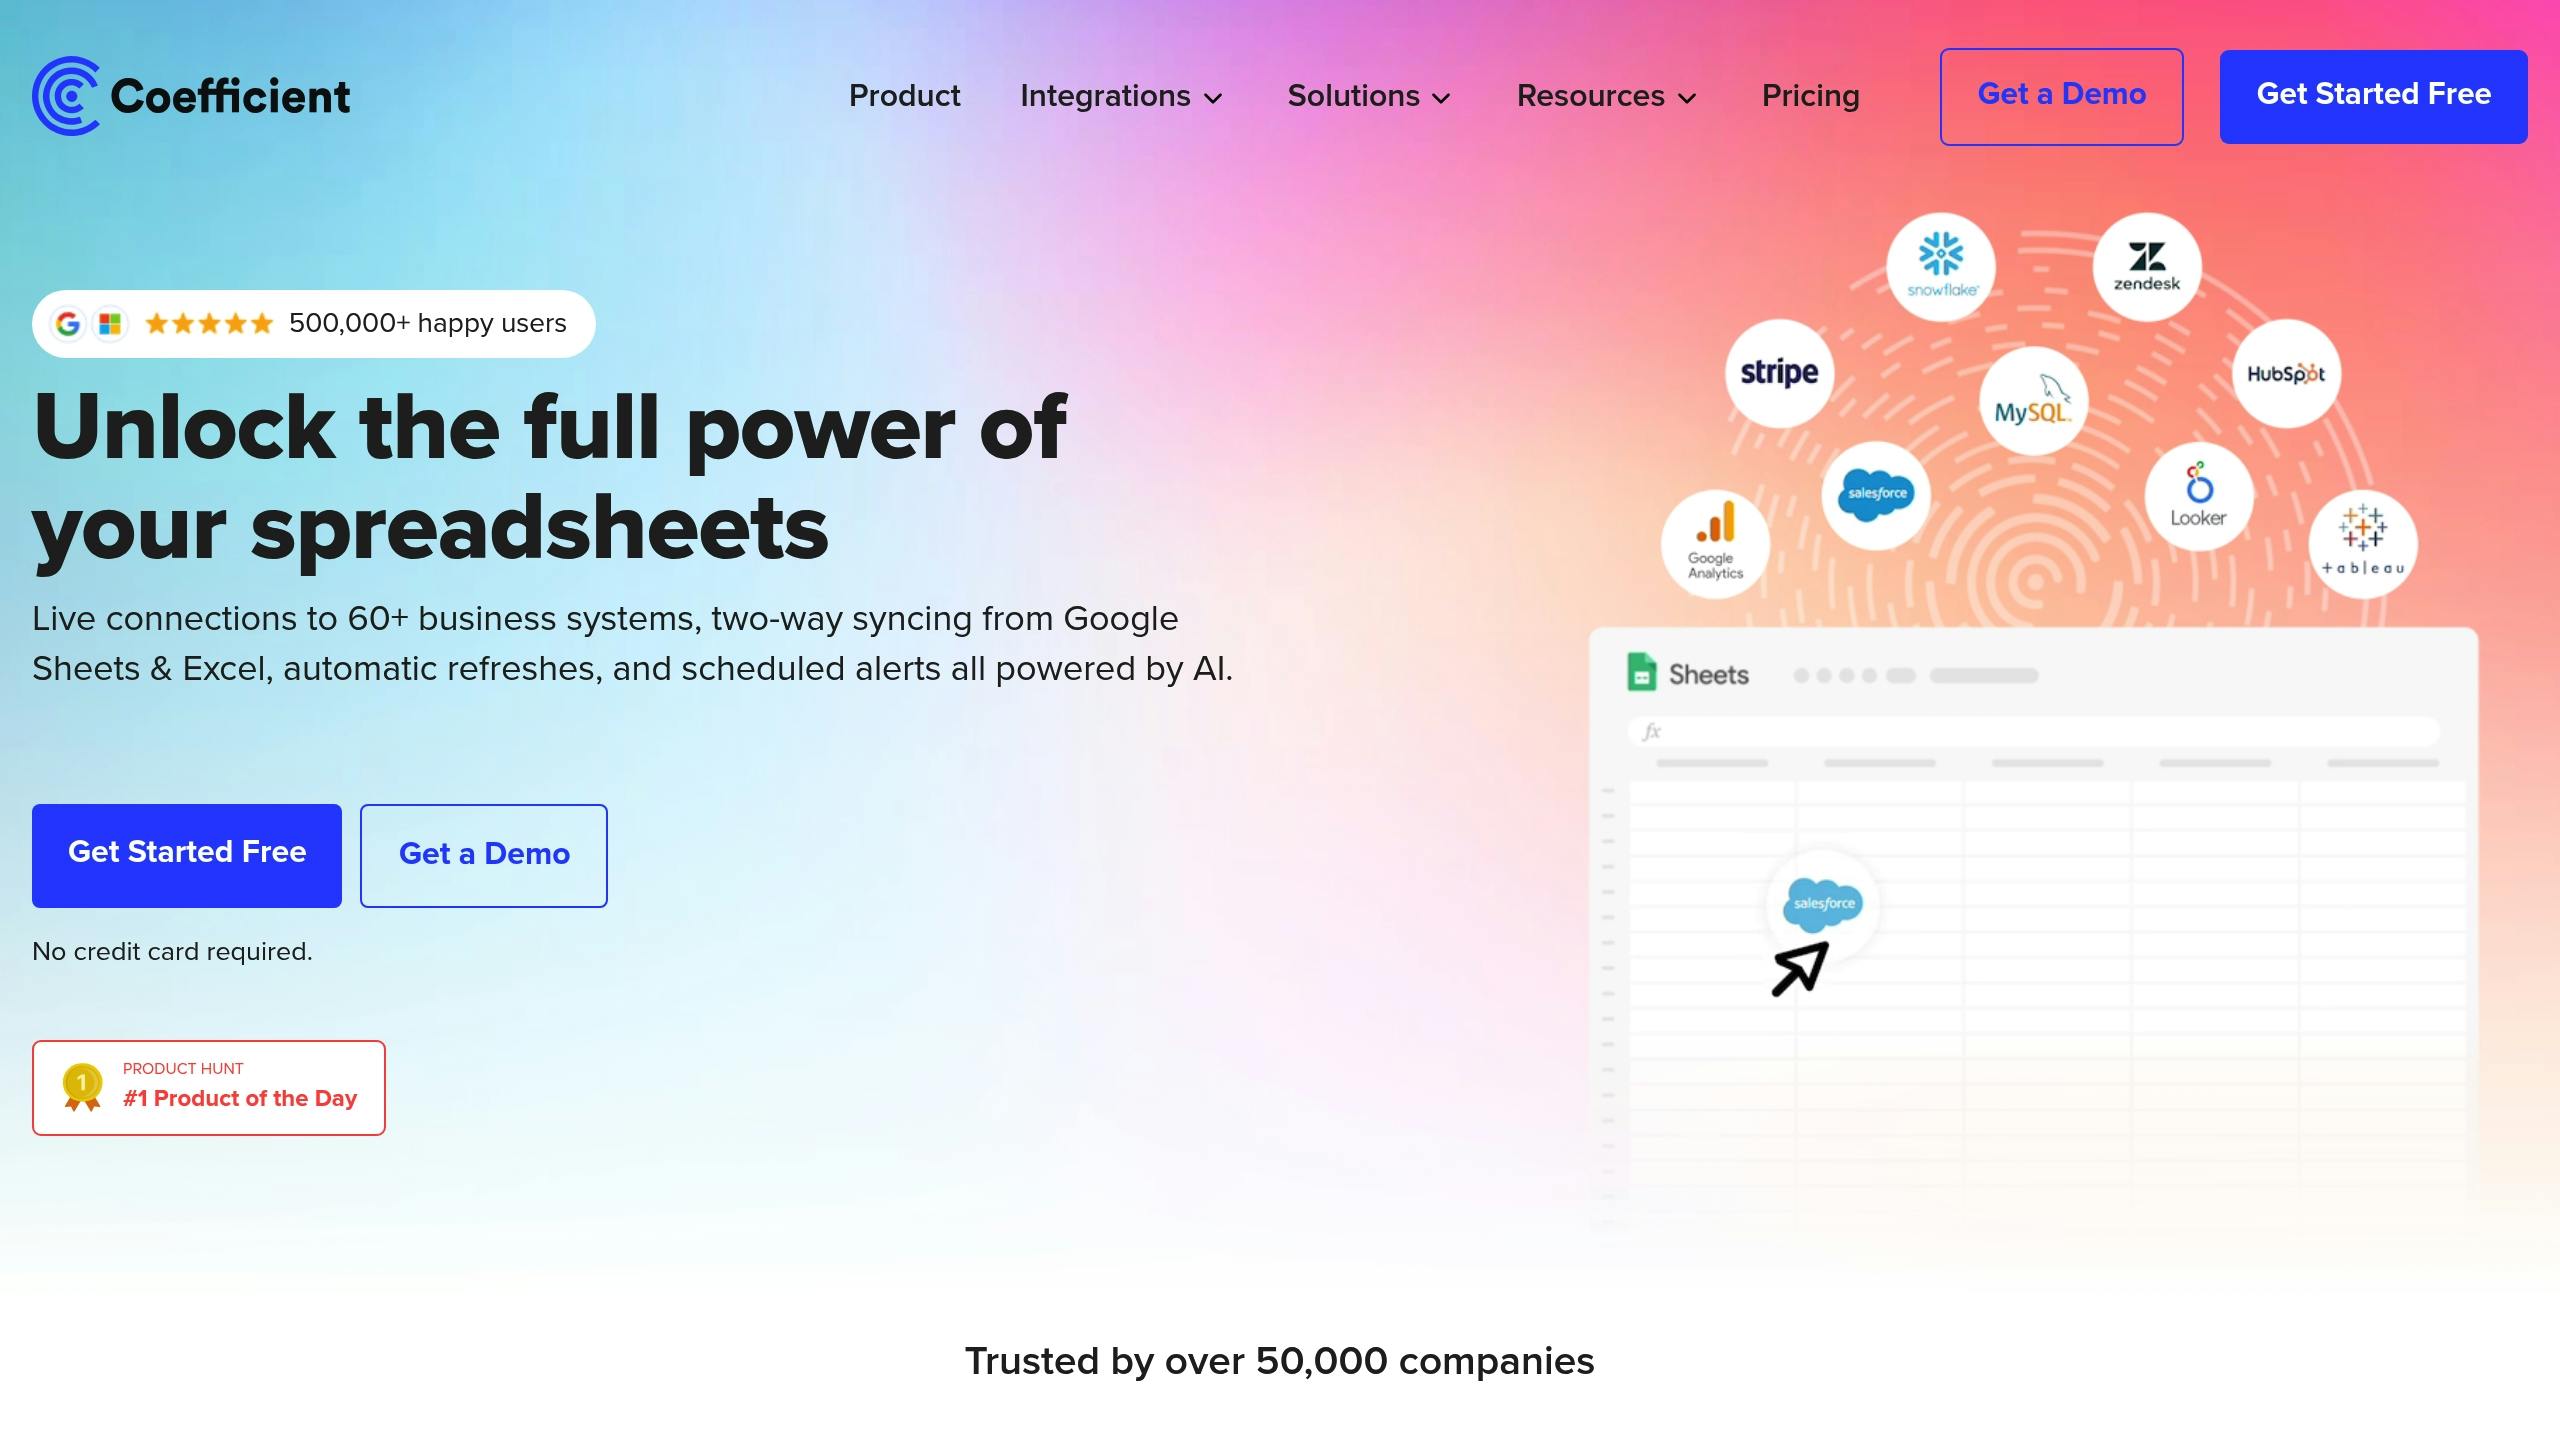
Coefficient is a tool built for Google Sheets that transforms spreadsheets into real-time sales analytics hubs. Trusted by over 503,000 users across 50,000+ companies , it provides a straightforward way to visualize sales data.
Key Dashboard Features
| Feature | Capability | Business Impact |
|---|---|---|
| Live Data Sync | Automatic updates from CRM | Always up-to-date insights |
| Pre-built Templates | Ready-to-use sales dashboards | Quick setup and deployment |
| Geographic Mapping | Sales by country with gradient maps | Tracks regional performance |
| Historical Analysis | Year-over-year comparisons | Identifies long-term trends |
| Top Account Tracking | Real-time monitoring of top accounts | Focuses on key clients |
Real-Time Data Integration
Coefficient syncs live data from CRMs, databases, and ad platforms directly into Google Sheets . Users can schedule updates hourly, daily, or weekly to ensure dashboards stay current .
Performance Tracking
The platform visualizes key sales metrics with easy-to-read charts and graphs. Sales leaders can monitor performance over different timeframes – yearly, quarterly, monthly, or weekly – and analyze trends by industry, region, or account type . These visuals simplify decision-making and help teams stay on top of their goals.
Impact on Revenue Operations (RevOps)
Companies using Coefficient report better efficiency. The tool’s ability to merge data from multiple sources supports accurate forecasting and real-time pipeline analysis . Its seamless integration with other sales tools further enhances its functionality.
Integration Capabilities
Coefficient supports over 100 integrations with popular business tools . Its two-way sync feature lets users not only pull data into spreadsheets but also push updates back to CRMs, streamlining workflows.
AI-Powered Analytics
With features like GPT Copilot and AI Auto Analyst, Coefficient speeds up data analysis. These tools help users quickly identify trends and uncover actionable insights .
"With Coefficient, our spreadsheets became true powerhouses of functionality. Not only could I design and optimize solutions, but I also could manage analytics, data modeling, hygiene reporting, and error checks with more scalability than ever before in Salesforce or Snowflake."
– Alexander Bugajski, Head of Go-to-Market Strategy
"Coefficient’s Google Sheets templates are the next step in spreadsheet evolution – connected spreadsheets mean faster, better, and more accurate analysis by everyone – especially if you can’t code!"
– Evan Cover, Director of BI Engineering and Governance, Klaviyo
7. ZoomInfo
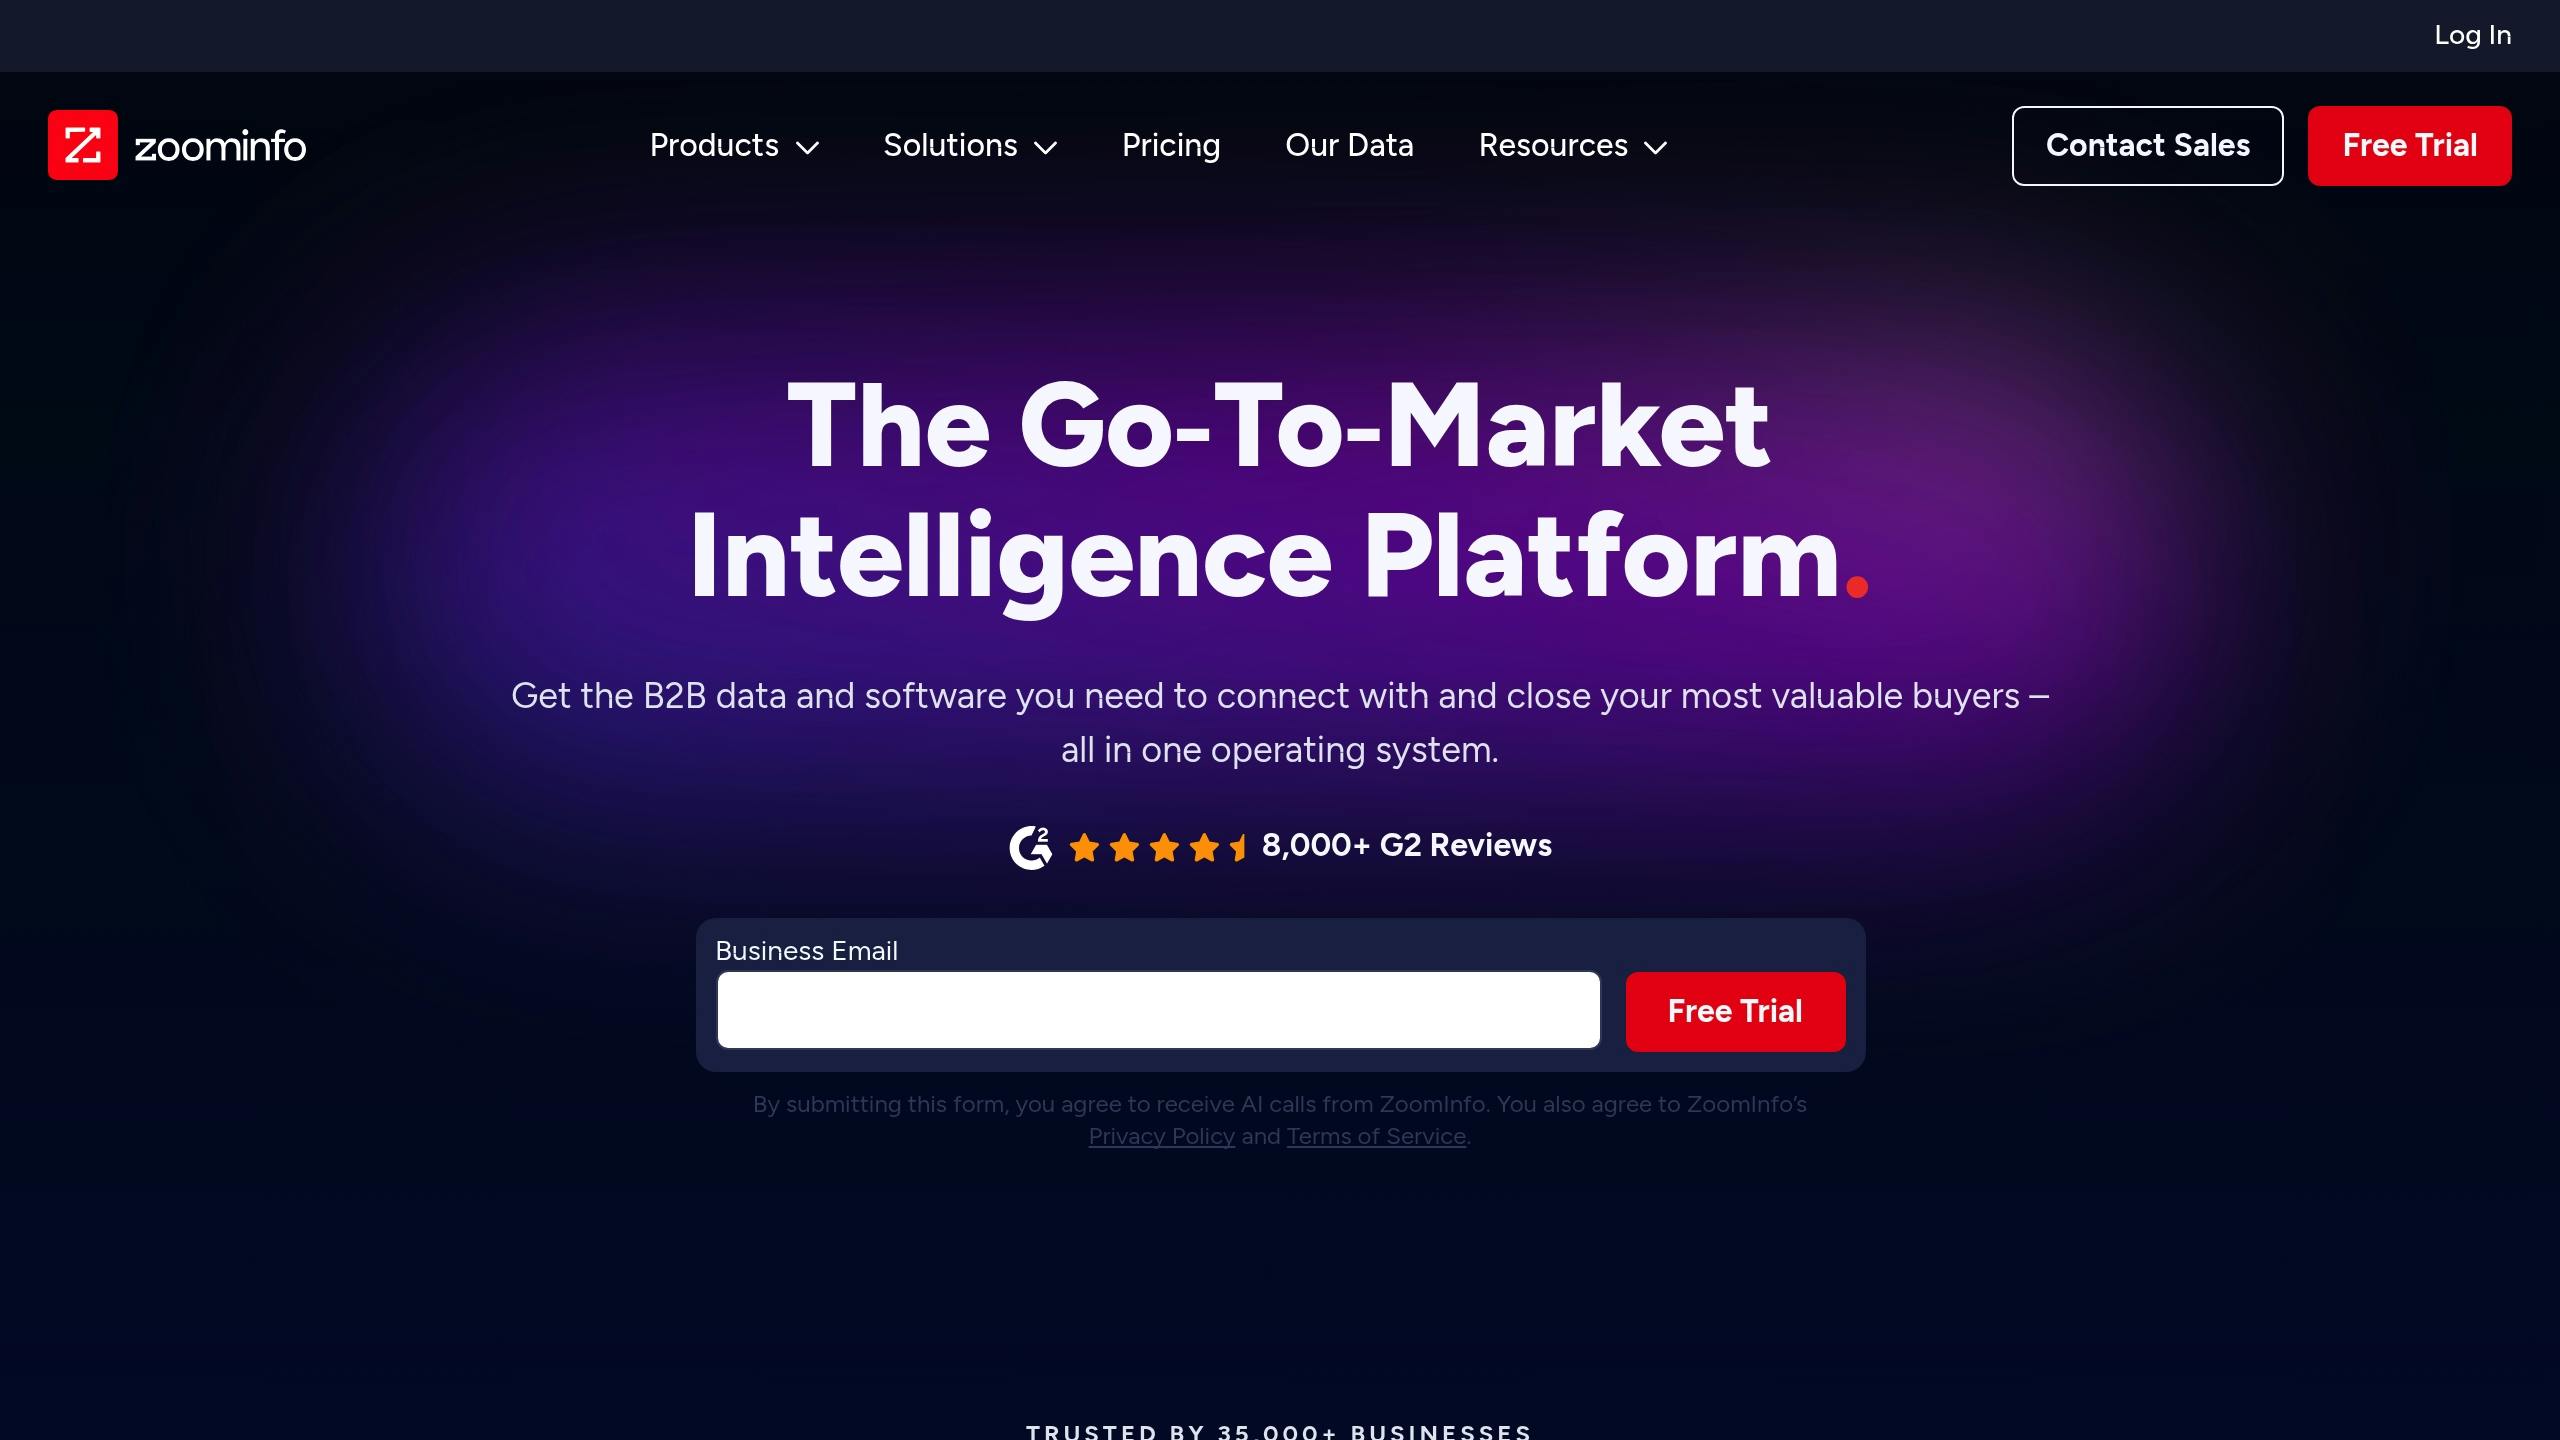
ZoomInfo is a sales intelligence platform that provides live data and insights tailored for RevOps teams. Here’s a closer look at what its dashboard offers:
Dashboard Intelligence Features
| Feature | Capability | Business Impact |
|---|---|---|
| Contact Database | 70M+ direct dials, 174M+ verified emails | Better prospect targeting |
| Buyer Intent Tracking | Real-time purchase signals | Focused outreach |
| Website Visitor Analytics | Live visitor identification | Improved lead qualification |
| Conversation Intelligence | Call analytics and insights | Enhanced sales coaching |
| Workflow Automation | Custom process automation | Simplified operations |
Real-Time Data Visualization
ZoomInfo’s dashboard provides live updates on prospect activity and integrates seamlessly with popular CRMs like Microsoft Dynamics 365 and HubSpot .
RevOps Performance Metrics
- Reduced sales cycles by 46 days
- Boosted secured meetings by 75%
- Increased win rates by 1.5x
Data Quality Management
The platform’s OperationsOS ensures clean, enriched, and standardized data, enabling more accurate decisions .
Integration Ecosystem
ZoomInfo connects with existing tools using its Chrome Extension, delivering insights directly into your workflow .
"Revenue operations is not any one tool, necessarily. It’s the systemic view of it all together, to identify, process, and then activate."
– Scott Sutton, VP of RevOps, ZoomInfo
Success Story
Reify Health saw a 38% pipeline growth after using ZoomInfo to enhance event and trade show data with accurate prospect information .
"With ZoomInfo, we’ve been able to increase the odds of reaching our target customers, augment the information that trade shows provide, and gain a more complete view of those prospects. It’s been very helpful, especially during the COVID-19 pandemic."
– Josh Penzias, Sales Operations Specialist at Reify Health
Next Steps for Choosing a Sales Dashboard
Set Clear Goals
Identify specific goals for your dashboard, such as tracking lead conversion, deal size, and churn rate . Focusing on these areas ensures your dashboard provides insights that drive action, not just data visuals.
Check Integration Needs
Before deciding on a dashboard, evaluate how well it integrates with your existing tools. Pay attention to these key systems:
| System Type | Selection Criteria | Priority Level |
|---|---|---|
| CRM Platform | Data sync capabilities | Essential |
| Marketing Tools | Lead tracking features | High |
| Communication Systems | Team collaboration tools | Medium |
| Analytics Software | Performance metrics | High |
Once you know your integration needs, you can map out a plan for implementation.
Plan the Rollout
Create a rollout schedule that minimizes disruptions while aiming for a quick return on investment.
Boost Dashboard ROI
Use automation tools – like manyforce for London-based B2B tech companies – to simplify reporting and improve data quality. These tools can make your dashboard more efficient and valuable.
Maintain Data Quality
To ensure your dashboard remains reliable, focus on these steps:
- Use automated data audits to catch errors early
- Provide thorough training for all users
- Set up a feedback loop to continuously improve dashboard performance
Think About Security and Growth
Your dashboard should handle increasing data volumes without sacrificing security . Look for features like strong access controls, compliance support, and the ability to scale as your needs grow.
Mobile-Friendly Features
Choose a dashboard with robust mobile functionality . This allows your team to make decisions on the go, whether in client meetings or while traveling.
Digital tools can help cut costs by up to 25% and increase revenue by 5-10% . Selecting a dashboard that meets these criteria ensures it supports your sales workflow and drives measurable results.

Leave a Reply